Gini Coefficient Explained: Measuring Income Inequality in 2025
The Gini coefficient is a statistical measure that shows how equally income or wealth is distributed in a country. This single number, ranging from 0 to 1 (or 0 to 100 as a percentage), works like an inequality thermometer—the higher the number, the more unequal the distribution.
- 0 = Perfect equality: Everyone earns exactly the same income
- 1 = Maximum inequality: One person has all the income, everyone else has nothing
Named after Italian statistician Corrado Gini (1912), this metric helps economists, policymakers, and researchers compare inequality levels across countries and track changes over time.
How the Gini Coefficient Works
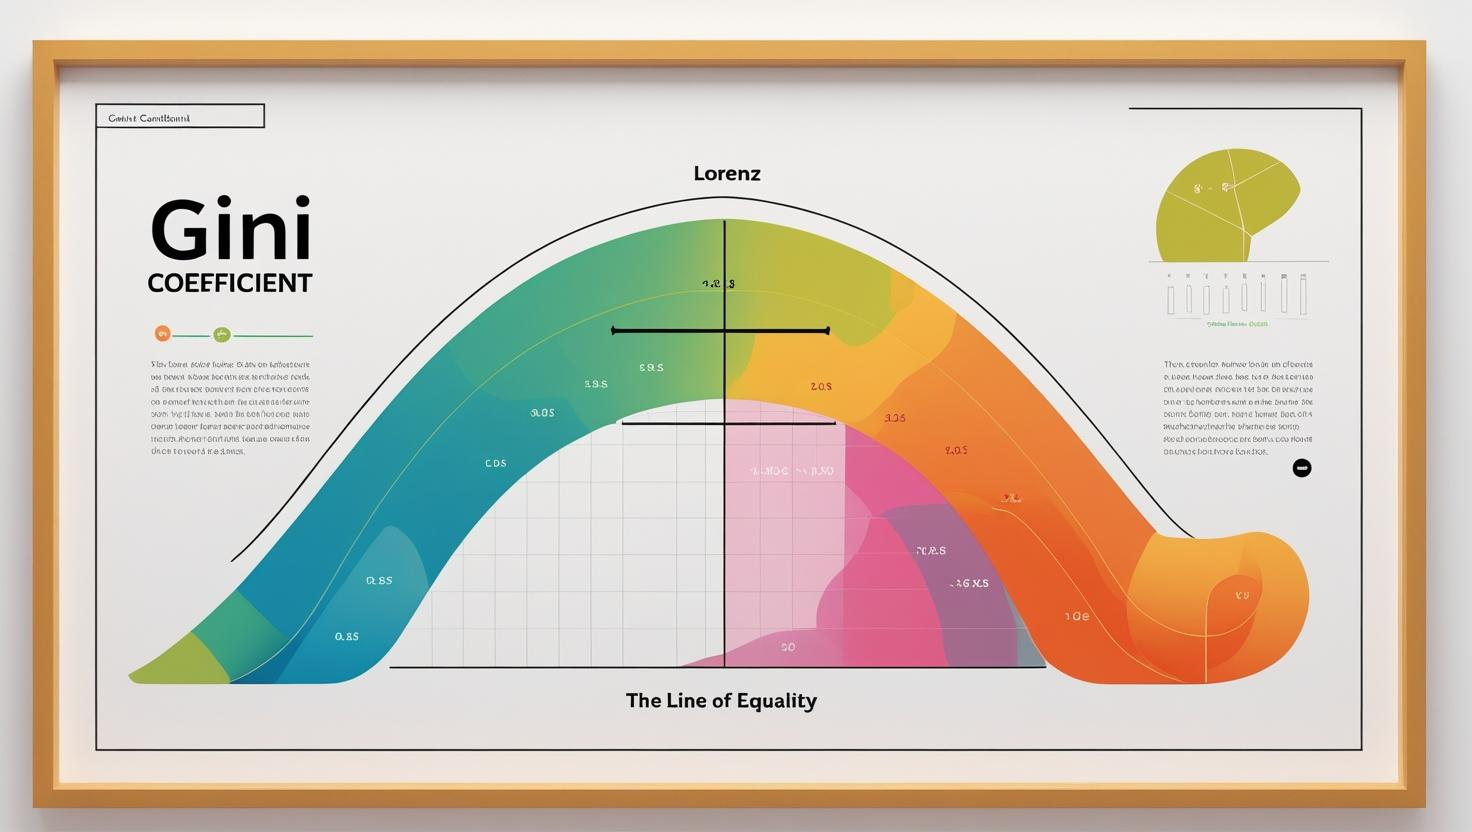
Imagine ranking everyone in a country from lowest to highest income, then plotting what percentage of total income each group earns. In a perfectly equal society, this creates a straight diagonal line—the bottom 20% would earn 20% of income, the bottom 50% would earn 50%, and so on.
The Gini coefficient measures how far a country’s actual income distribution curves away from this perfect equality line. The larger the gap, the higher the Gini coefficient.
Example: If the bottom 50% of people earn only 10% of total income while the top 10% earn 55%, this creates a high Gini coefficient indicating significant inequality.
Global Gini Coefficient Rankings 2024
Low Inequality Countries (Gini 0.25-0.35)
- Nordic Countries: Denmark, Finland, Iceland, Norway
- Eastern Europe: Czech Republic, Slovakia, Slovenia
- Characteristics: Strong social safety nets, progressive taxation, robust labor protections
Moderate Inequality Countries (Gini 0.35-0.45)
- Western Europe: Germany, France, Austria, Belgium
- Characteristics: Market economies with significant government intervention
High Inequality Countries (Gini 0.45-0.60)
- United States: Gini coefficient ~0.48 (income), ~0.85 (wealth)
- United Kingdom: Post-Brexit inequality challenges
- Characteristics: Limited social programs, lower tax progressivity
Very High Inequality Countries (Gini 0.60+)
- Latin America: Brazil, Chile, Colombia (top 10% earn ~60% of income)
- Africa: South Africa (Gini ~0.65, top 10% hold ~65% of income)
- Characteristics: Legacy of colonialism, limited social mobility


Income vs. Wealth Gini Coefficient
Income Gini Coefficient
- Measures annual earnings distribution (wages, salaries, business income)
- Typically ranges 0.25-0.65 globally
- Shows current economic flows
Wealth Gini Coefficient
- Measures accumulated assets distribution (property, savings, investments minus debt)
- Always higher than income inequality
- U.S. wealth Gini: ~0.85 (among world’s highest)
Why the difference matters: Two families with similar incomes may have vastly different wealth levels, affecting economic security and opportunities.
What Gini Coefficients Mean in Real Life
Low Inequality (0.25-0.30)
- Middle-class family earns 3-4x minimum wage
- Most people can afford housing, healthcare, education
- High social mobility
Moderate-High Inequality (0.40-0.50)
- Professional families earn 6-8x service worker wages
- Access to quality services becomes income-dependent
- Moderate social mobility
Very High Inequality (0.60+)
- Elite families earn 20-50x typical worker wages
- Separate economic worlds, limited social mobility
- Increased social tension
Why the Gini Coefficient Matters
Economic Impact
- Moderate inequality can incentivize innovation
- Extreme inequality often slows economic growth
- High inequality reduces consumer demand
Social Outcomes
- Lower Gini = higher social mobility
- Higher Gini = increased crime, health problems, political instability
- Affects entire communities, not just the poor
Policy Measurement
- Tracks effectiveness of inequality-reduction policies
- Enables international comparisons
- Helps set measurable policy goals
United States Gini Coefficient: A Case Study
The U.S. presents a striking example of high inequality among developed nations:
- Income Gini: ~0.48 (closer to Mexico and Turkey than European peers)
- Wealth Gini: ~0.85 (extreme concentration)
- Trend: Top 10% income share rose from 34% (1980) to 47% (2023)
This places America among the most unequal developed countries, reflecting decades of policy choices favoring wealth concentration.
Limitations of the Gini Coefficient
What It Doesn’t Show
- Absolute poverty levels: Low inequality doesn’t mean prosperity
- Distribution details: Same Gini can hide different inequality patterns
- Causes: Doesn’t indicate which policies created the outcomes
Measurement Challenges
- Requires comprehensive income/wealth data
- Wealthy individuals often hide assets
- Informal economies difficult to capture
Using Gini Coefficients for Policy Analysis
Best Practices
- Track trends over time rather than single snapshots
- Compare similar countries for meaningful benchmarks
- Combine with other metrics (poverty rates, median income)
- Consider both income and wealth measurements
Policy Applications
- Evaluate tax system progressivity
- Assess social program effectiveness
- Set inequality reduction targets
- Guide resource allocation decisions
Gini Coefficient by Region: 2024 Data
Europe (Lowest Inequality)
- Average Gini: 0.30-0.35
- Top 10% earn ~36% of income
- Strong welfare states, progressive taxation
North America (High Inequality)
- U.S. Gini: 0.48 (income), 0.85 (wealth)
- Canada: More equal than U.S., less than Europe
- Policy differences drive variation
Asia (Mixed)
- Wide variation from Japan (low) to India (very high)
- China: Rising inequality with economic growth
- Policy choices shape outcomes
Latin America (Highest Inequality)
- Average Gini: 0.50-0.60
- Top 10% typically earn 60%+ of income
- Historical factors and limited redistribution
Improving Gini Coefficients: Policy Lessons
Countries with lower Gini coefficients typically employ:
Progressive Taxation
- Higher rates on wealth and high incomes
- Closed tax loopholes and offshore havens
- Revenue funds public services
Strong Social Safety Nets
- Universal healthcare and education
- Unemployment benefits and job training
- Housing assistance programs
Labor Protections
- Collective bargaining rights
- Minimum wage standards
- Worker representation in corporate governance
Public Investment
- Infrastructure development
- Research and development funding
- Small business support programs
Conclusion: The Inequality Report Card
The Gini coefficient serves as democracy’s inequality report card, revealing whether economic systems work for everyone or concentrate benefits among elites. While no single metric tells the complete story, Gini coefficients provide valuable insights for:
- Citizens: Understanding their country’s economic fairness
- Policymakers: Measuring intervention effectiveness
- Researchers: Comparing inequality impacts across societies
- Activists: Advocating for evidence-based reforms
Countries with lower Gini coefficients prove that market economies can maintain both prosperity and equity through deliberate policy choices. The coefficient isn’t just a number—it’s a tool for building more inclusive economic systems.
For Americans concerned about economic fairness, international Gini comparisons demonstrate that current inequality levels aren’t inevitable. Other developed nations show that dramatic inequality reduction is possible while preserving economic dynamism and individual opportunity.
Understanding the Gini coefficient empowers informed participation in debates about taxation, social policy, and economic regulation—the very policies that determine whether future inequality measurements trend toward greater fairness or continued concentration.









Leave a comment